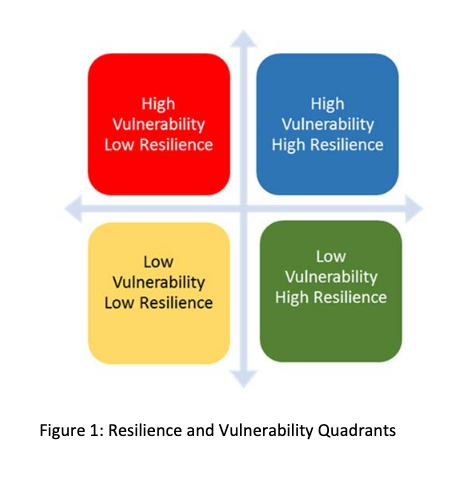
The indexes are organized based on indicators in four categories — social, economic, infrastructure and environmental— for every county in the United States. In each category the index matrix was used to categorized counties based on a set of county-level indicators gathered through publicly accessible data sources. From this, counties were scored and ranked on the index according to their standing relative to the national median resiliency and vulnerability in each category. Many indicators used in determining this score were updated in April 2017 with the most recent data available from the 2011-2015 American Community Survey from the US Census Bureau. In total, about half of the infrastructure data sets were updated and over two-thirds of the social and economic indicators.
Environmental
Environmental measures are designed to capture the likelihood of disasters befalling a community. Consideration has to be given to the number of and type of disasters and how to account for the bias that occurs in measuring disasters that are isolated in geographic regions (for example, Midwestern counties face limited risk for hurricane activity).
Environmental Resilience Index
- Environmental diversity
Environmental Vulnerability Index
- Drought
- Seismic hazard
- Proximity to levees
- # of severe storm events
- Diversity of storm events
Economic
Economic measures describe the economic strength and vulnerability of a community or region.
Economic Resilience Index
- Average nonfarm proprietor income
- Proprietors as a percentage of total nonfarm employment
- Establishment births
- Employment sector diversity
- Labor force participation
Economic Vulnerability Index
- Business vacancy rate
- % of households spending 30% or more of total income on housing costs
- Unemployment rate
- % of population employed in extractive industry and/or manufacturing
Infrastructure
Infrastructure measures rate the capacity of a community to withstand a natural disaster and manage evacuations and immediate repairs follow a disaster event. The vulnerability indicators capture particular at-risk infrastructure as well as potential challenges to evacuation and rebuilding efforts.
Infrastructure Resilience Index
- # of persons in emergency response occupations as a percentage of total county population
- % of population within 1 mile of a grocery store
- % of population within 10 miles of a hospital with an emergency room
- Evacuation routes – lane miles
- # of primary care physicians per capita
- Per capita expenditures on police and fire
- Evacuation routes – lane miles
Infrastructure Vulnerability Index
- High-detour bridges
- % of homes built before 1960
- % of housing units that are mobile homes
- % of population within 5 miles of a dam
- % of population with no motor vehicle
- % of population within 10 miles of a nuclear facility
- Unsafe drinking water
Social
Social measures are intended to capture the degree to which a community has a strong set of social and human capital with which to rebound from a potential hazard event. Social vulnerabilities are characteristics of the population or community that cause isolation or erosion of social capital, and therefore work against the community following a disaster.
Social Resilience Index
- # of nonprofits per capita
- # of associations per capita
- Voter participation rate
- % of population with a Bachelors degree or higher
- Life expectancy
- % of housing units that are owner occupied
- % of population living in same county as one year prior
Social Vulnerability Index
- % of population age 65+
- % of population under the age of 18
- % population disabled
- Violent crime rate
- Income inequality (GINI Index)
- # of jurisdictions
- % of households that are linguistically isolated
- % of population living below 100% of poverty
- % of population without health insurance
Learn more about the methodology behind the resiliency index and selected indicators here.
